For many office workers, Microsoft Excel is simply the go-to spreadsheet application. But since the late 1990s, Microsoft has been adding analytics functionality, and it’s accelerating the process with its monthly updates to Office 365. Excel now has some fairly potent tools for doing much greater data analysis than calculating a few rows.
And a lot of people are using those tools. A study released earlier this year by SourceMedia Research and commissioned by data-prep tool vendor Paxata found that 68% of organizations use Microsoft Excel as their main means of doing data preparation. The study surveyed 290 executives and IT professionals at organizations with $100 million or more in annual revenue — not exactly small businesses.
Nor were they just companies merely experimenting with big data. The survey found that even in organizations with mature data quality, Excel, custom coding, and SQL are used quite significantly. In other words, even companies with a mature analytics initiative are sticking with Excel rather than abandoning it for something more heavy-duty.
“There are [more than] 750 million Excel users, so you have a lot of people who know how to sort and filter and do pivot tables,” says Bill Jelen, a.k.a. MrExcel, who specializes in Excel training. “You already have this massive base of people who already know how to use the product, so there’s not the learning curve [that you would have], if you bought some other third-party tool, to get everybody trained on that product.”
“We see Excel is almost always the starting point for any analytics or business process,” says Brian Jones, group program manager for Excel at Microsoft. “People start in Excel, and then for certain projects that become really large they might graduate to using something like Microsoft Project. The power of Excel is it allows you to do all those grass-roots business processes and, given [that] business processes change all the time, people can adapt.”
Jim Sullivan, an independent consultant in Denver, says that while Excel is designed to be an accounting and bookkeeping tool at its core, there are a lot of templates out there now to do ROI analysis. “People use it for a lot of different things, and it functions at least acceptably in everything I’ve seen it [do]. It’s a lousy presentation tool, but it gives good graphs to put into your PowerPoint presentation,” he adds.
Power tools
At the heart of Excel is the pivot table, which lets you rapidly summarize rows of data in a small, condensed report. Data lookups are usually done in Excel with the Vlookups feature, which is fine in a few thousand rows, but when you get into millions, it gets bogged down.
 Microsoft
The basics: Pivot tables in Excel (click on any image in this story to enlarge it)
So over time, Microsoft has added features and tools to Excel to make it more powerful for analytics. One, which Microsoft’s Jones says the company spent five years working on, is Power Pivot, which addresses a shortcoming of Excel: It supports only 1 million rows. In big data, where data can stretch into the tens of millions if not billions of rows, that limit is too restrictive.
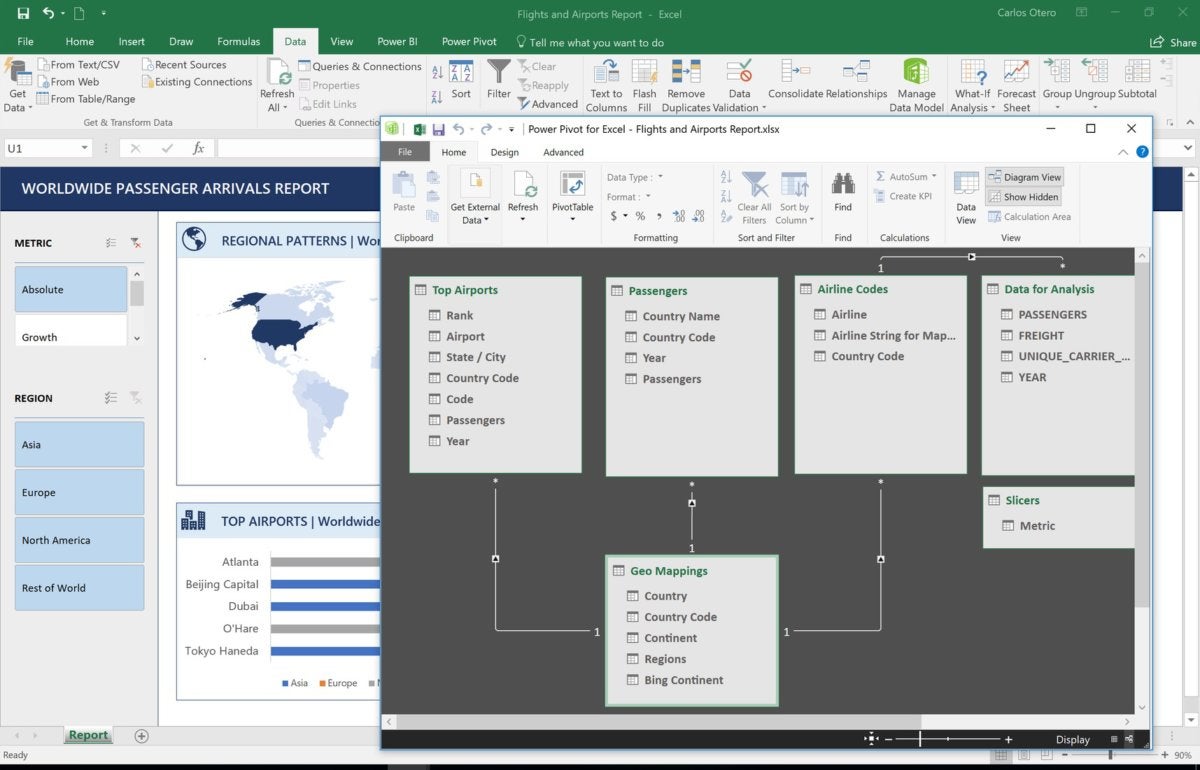
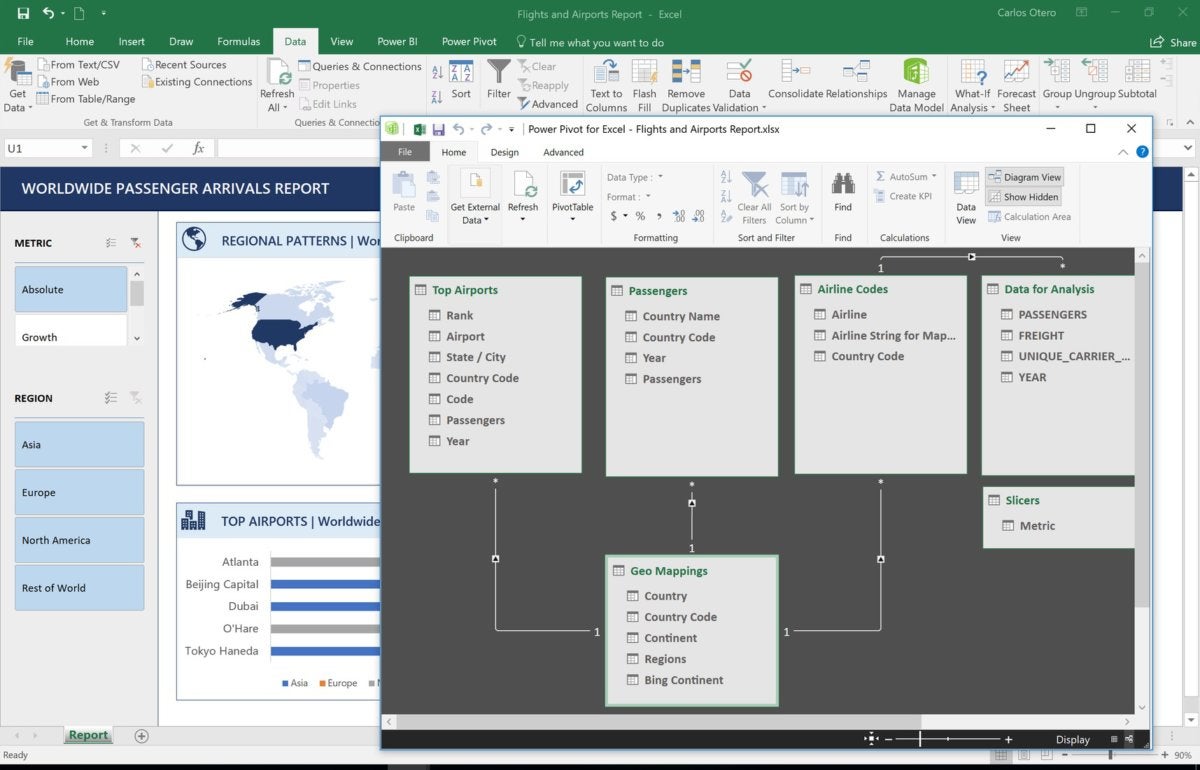
Power Pivot, commonly referred to as an internal data model, lets Excel handle millions of rows and do multiple joins to do more complex tables than in the basic pivot table. Power Pivot is basically the SQL Server Analysis Services engine running within Excel. According to Jones, the technology is shared across SQL Server and Power BI, Microsoft’s suite of business analytics tools, so Power Pivots developed in Excel can be migrated to the server if need be.
 Microsoft
You can do multiple joins of tables with Power Pivot.
Power Pivot is available as an add-in for Excel 2010 and is native in Excel 2013, 2016 and 2019 for Windows.
 Microsoft
Joined tables in Power Pivot can then be used to create reports.
Because Power Pivot acts as a data model, you need to import some data first. Many structured data apps have an “Export to Excel” option, but Microsoft has also added a number of import options. It can read data from Active Directory, XML, text, JSON, SQL, HDFS, OData, SharePoint, Exchange, Salesforce, Oracle, DB2, PostgreSQL, SAP HANA and TeraData, just to name a few.
After fetching the data, you will probably need to do some cleaning or transformation on it, especially if it’s raw data from a data lake. This is done by another add-in-turned-native-feature originally called Power Query, and now known as Get & Transform.
 Microsoft
Do data cleaning with Get & Transform (a.k.a. Power Query).
Jelen says this data-cleaning tool is quite powerful and useful because it remembers the process you took to clean data from a source, such as removing columns or adding them together, and does it again when you refresh the data source. “It looks so boring, but people have no idea how much power is behind those tools,” he says.
Another add-in for Excel is Power View, a data visualization tool for creating several kinds of charts, tables and even maps. Jelen notes that Excel charting has 79 chart types built in and will soon use Power BI charts, so you can create beautiful graphic summaries of your data and customize it.
Then there is Data Table, which Jelen says is another versatile tool, this one for sensitivity analysis, or what-if analysis. Data Tables let you create forecasting models with different models for answering hypotheticals such as, “If next year’s budget changes by x or y amount, how much will expenses have to be cut?” Or it can be used in a mortgage calculator to determine how interest rate changes would affect monthly payments.
 Microsoft
Use Data Table for what-if analysis.
Old-school Excel came with a forecasting ability that looked at historical data and made forecasts with a high-low numeric range, but it was fairly linear, says Jones. For Excel 2016, Microsoft worked with its research group to develop Forecast Sheets, which can do more accurate financial projections around questions such as “What happened?” “Why did it happen?” and “What’s going to happen because of it?” Specifically, Microsoft added the ability for Excel to automatically understand seasonality in the data, handle missing values, and use an exponential smoothing technique.
Microsoft has also recently made AzureML, the machine-learning service in its cloud computing platform Azure, native to Excel, to make it easy to call Azure web services directly within Excel without the need to write any code. You can, for example, do what’s known as sentiment analysis on sales that looks at things such as positive or negative feedback from customers.
“The idea is data scientists are building much more complex models, more complex forecasting,” says Jones. “You’ll have your data scientists building ML models, and you can run them as a web service that people can call as a function name.” With the rise of data analytics, more business users have the need to work with data in more sophisticated ways. Excel’s integration with AzureML allows regular business users to benefit from the work of their data scientists more easily than before.
Weaknesses
There are shortcomings to Excel as an analytics tool, and fairly obvious ones. For starters, it’s a client-side tool, and performance is at the mercy of the individual user’s computer. If your company has been slow to upgrade and you are running a Windows 7-era laptop with a 2010 Intel CPU and 4GB of memory, you really don’t want to do analytics on a 4 million-row database. Power Pivot requires the 64-bit version of Excel, and the compression may be dependent on the data’s characteristics.
The other problem is that your computer has to remain on. That combined with a poky laptop is a recipe for non-productivity. Sullivan once worked with a 30-store retail company that used Excel for managing inventory. “They built an elaborate workbook that took manual counts from stores and ran comparisons to a database and gave deviations. That would run for four to eight hours, if it ran completely,” he says. “We took all the calculations and put them in SQL Server and it was done in five minutes.”
Jelen also discourages the use of Excel in anything inventory-related. As you buy new raw materials, each purchase has a different cost, he notes, so as you consume the materials, you have to track which material you used: the one costing x dollars or the one costing y dollars. “That’s where accounting software like QuickBooks just runs circles around Excel,” he says.
Coming soon
Microsoft regularly adds new features to the Office 365 version of Excel, and an updated packaged version is part of Office 2019, which was released in September. Microsoft’s Jones says the company is adding new data sources and new means to gain insights out of the data as well as exposing many of these features under one tab, the Insights tab.
Jones says Microsoft is also adding more machine learning to make high-end features available to do all kinds of ad hoc analysis, make the product more approachable, improve performance and reliability, and add teamwork support. Microsoft just recently added the ability for more than one person to work in an Excel file at the same time, and it wants to expand on that to allow groups of people to do analytics. These features have not been formally announced but are coming, Jones says.
So if you’ve just been using Excel to do simple calculations, you’ve barely scratched the surface of what it’s capable of. Since it’s a tool you already use, it’s an easy way to start learning more about analytics.


